Null and Alternative Hypotheses Explained with Real Examples

A statistics exam drops the phrase “the null and alternative hypotheses are given” and half the room freezes. Not because the math is hard, but because the logic underneath feels slippery. Which one gets the equals sign? Which one carries the research claim? And why does swapping them ruin everything?
These two hypotheses form the skeleton of every statistical test ever run — from randomized drug trials published in The Lancet to the A/B test that changed your favorite app’s checkout button last Tuesday. Get them right and the rest of the analysis falls into place. Get them wrong and no amount of clever computation can save the conclusion.
What follows is a plain-language breakdown with real worked examples from medicine, psychology, and business, a symbol-by-symbol notation guide, a one-tailed versus two-tailed decision framework, and the five mistakes that trip up students most often.
What Are the Null and Alternative Hypotheses?
Every hypothesis test begins with two competing statements about a population parameter. One claims nothing interesting is happening. The other claims something is. The entire machinery of inferential statistics exists to decide which claim the data support.
The Null Hypothesis (H₀)
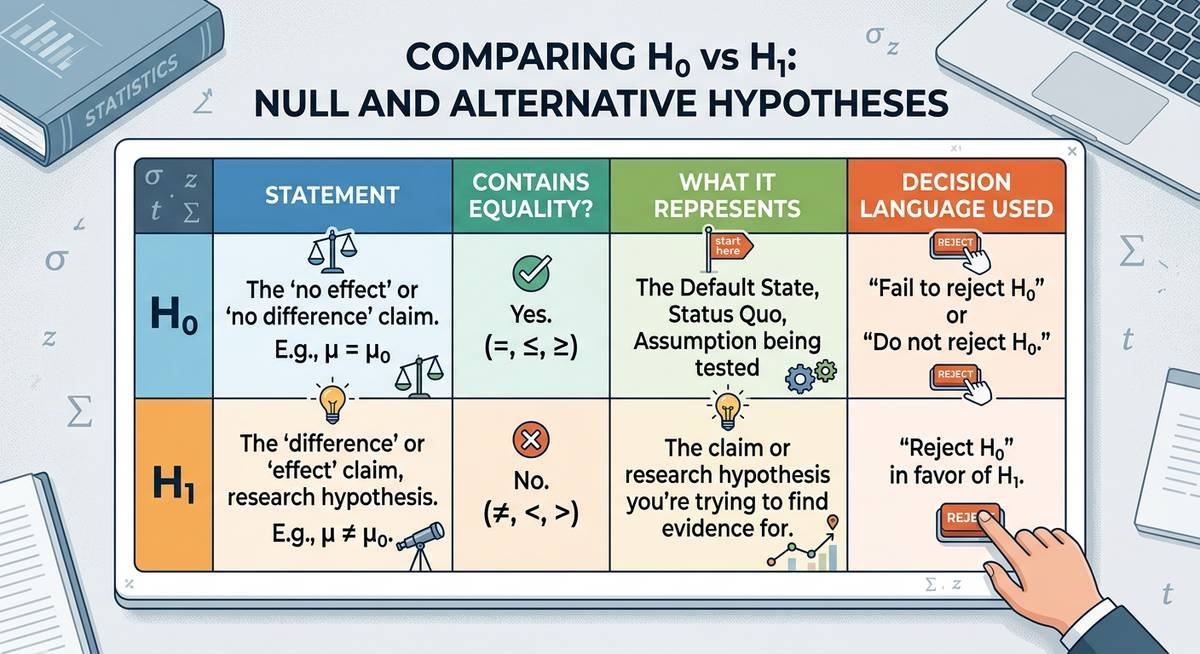
H₀ is the skeptic in the room. It asserts that there is no effect, no difference, and no relationship — that whatever the researcher suspects is happening simply is not. A drug does not lower blood pressure. A new teaching method does not raise test scores. A redesigned landing page does not improve conversions.
Structurally, H₀ always contains an equality operator: =, ≤, or ≥. That equality anchors the probability distribution used to calculate the test statistic and p-value. Without it, the math has no fixed reference point. The null hypothesis is not something a researcher tries to prove — it is something a researcher tries to gather enough evidence to reject.
The Alternative Hypothesis (H₁ or Hₐ)
H₁ carries the burden of ambition. It represents the research claim — the effect, difference, or relationship the investigator suspects exists and wants the data to confirm. Where H₀ uses equality, H₁ uses strict inequality: ≠, <, or >. The specific operator chosen here dictates whether the test is one-tailed or two-tailed, which directly shapes how the p-value is calculated.
A critical distinction that trips up beginners: H₁ is never assumed true. It is never “proven.” When the data are strong enough, a researcher rejects H₀ — and the alternative is supported by implication. That gap between “supported” and “proven” is not pedantic. It is the entire philosophical foundation of frequentist inference, first formalized by Jerzy Neyman and Egon Pearson in their 1933 paper on hypothesis testing.
How They Work Together
H₀ and H₁ are mutually exclusive and collectively exhaustive. Exactly one describes reality — there is no third option, no “maybe” category. Think of it like a courtroom: H₀ is the presumption of innocence, H₁ is the prosecution’s case, and the data serve as evidence. If the evidence is compelling enough (typically p < 0.05), the jury rejects the default presumption. If not, H₀ stands — but that does not mean the defendant is innocent. It means the prosecution did not meet its burden.
Failing to reject H₀ is not the same as confirming it. Ronald Fisher, the statistician who pioneered significance testing in the 1920s, put it bluntly: the null hypothesis is never proved, only possibly disproved.
| Feature | Null Hypothesis (H₀) | Alternative Hypothesis (H₁) |
|---|---|---|
| Default status | Assumed true until disproven | Must be earned through evidence |
| Operator | =, ≤, or ≥ (always includes equality) | ≠, <, or > (strict inequality) |
| Represents | No effect, no difference | The research claim or suspected effect |
| Decision language | “Reject H₀” or “Fail to reject H₀” | “Evidence supports H₁” (never “proved”) |
| Burden of proof | None — it is the starting position | Full burden rests here |
Symbolic Notation Guide: Reading the Formulas
When the null and alternative hypotheses are given in symbolic form on an exam or in a journal article, the notation follows a universal grammar. Once you learn to read it, every hypothesis statement — regardless of discipline — decodes the same way.
Key Symbols and What They Mean
| Symbol | Name | Plain-English Meaning | Typical Context |
|---|---|---|---|
| H₀ | Null hypothesis | The default claim — nothing is happening | Always the starting assumption |
| H₁ / Hₐ | Alternative hypothesis | The research claim — something is happening | Accepted only when H₀ is rejected |
| μ | Population mean | The true average for the entire population | Blood pressure, test scores, salaries |
| p | Population proportion | The true rate or percentage in the population | Cure rates, click-through rates, defect rates |
| σ | Population standard deviation | How spread out values are across the population | Quality control, variance tests |
| = | Equals | Is exactly equal to a stated value | H₀ in two-tailed tests |
| ≠ | Not equal to | Differs from the stated value in either direction | H₁ in two-tailed tests |
| < | Less than | Falls below the stated value | H₁ in left-tailed tests |
| > | Greater than | Exceeds the stated value | H₁ in right-tailed tests |
| ≤ / ≥ | Less/greater than or equal to | At most / at least the stated value | H₀ in one-tailed tests |
One-Tailed vs. Two-Tailed: How to Choose
The inequality in H₁ determines the tail configuration of the test, and this is where many students make their first wrong turn. The decision rule is straightforward once you see it clearly.
Two-tailed test (H₁ uses ≠): You suspect a difference exists but have no theoretical reason to predict its direction. The critical region splits across both ends of the distribution. Academic journals default to two-tailed tests because researchers often lack prior evidence to commit to a direction. If a psychology paper reports p < 0.05, it almost certainly came from a two-tailed test.
One-tailed test (H₁ uses < or >): You have a specific, pre-registered directional prediction. A pharmaceutical company does not merely claim its drug “changes” blood pressure — it claims the drug lowers it. That directional commitment concentrates all statistical power in one tail, making it easier to detect a real effect in that direction but completely blind to effects in the opposite direction.
A practical decision sequence: Does the research question specify a direction (higher, lower, faster, slower)? If yes, use one-tailed. If the question uses neutral language (different, changed, affected), use two-tailed. When genuinely uncertain, two-tailed is the safer and more widely accepted default.
Step-by-Step Worked Examples Across Disciplines
Reading definitions is one thing. Translating a messy real-world problem statement into crisp H₀ and H₁ notation is another. These three examples walk through the reasoning from problem statement to final symbolic form.
Example 1 — Medicine: Clinical Drug Trial
Problem: A pharmaceutical company claims its new antihypertensive drug reduces average systolic blood pressure below 130 mmHg in adults with stage 1 hypertension.
The claim uses the word “reduces” and specifies a direction — below 130. That directional language signals a one-tailed (left-tailed) test. The null hypothesis defends the status quo: the drug does nothing, so the true mean stays at or above 130.
- H₀: μ ≥ 130 mmHg (the drug does not reduce average blood pressure below 130)
- H₁: μ < 130 mmHg (the drug reduces average systolic blood pressure below 130)
- Test type: One-tailed, left-tailed
- Parameter: μ (population mean)
The FDA requires this kind of directional hypothesis in Phase III trial protocols — a company must pre-specify exactly what it claims before collecting data, precisely to prevent data dredging after results come in.
Example 2 — Psychology: Sleep Deprivation Study
Problem: A researcher hypothesizes that 48 hours of sleep deprivation changes average reaction time compared to the well-rested population mean of 250 milliseconds.
The word “changes” is non-directional. Reaction time might slow down (the obvious guess) or, under certain acute stress responses, temporarily speed up. Because no direction is committed to, this calls for a two-tailed test.
- H₀: μ = 250 ms (sleep deprivation does not change average reaction time)
- H₁: μ ≠ 250 ms (sleep deprivation changes reaction time in either direction)
- Test type: Two-tailed
- Parameter: μ (population mean)
The American Psychological Association’s reporting guidelines strongly favor two-tailed tests in published research, a convention rooted in the discipline’s historical emphasis on replication over prediction.
Example 3 — Business: A/B Conversion Experiment
Problem: A marketing team believes that a redesigned checkout page increases purchase conversion rate above the current baseline of 3.2%.
“Increases” locks in a direction — right-tailed. And because the parameter is a rate (percentage), the test uses a population proportion (p) rather than a mean (μ).
- H₀: p ≤ 0.032 (the redesign does not increase the conversion rate)
- H₁: p > 0.032 (the redesign increases the conversion rate above 3.2%)
- Test type: One-tailed, right-tailed
- Parameter: p (population proportion)
| Discipline | Parameter | H₀ | H₁ | Tail |
|---|---|---|---|---|
| Medicine | μ (mean) | μ ≥ 130 | μ < 130 | Left |
| Psychology | μ (mean) | μ = 250 | μ ≠ 250 | Two |
| Business | p (proportion) | p ≤ 0.032 | p > 0.032 | Right |
Five Common Mistakes When Writing Hypotheses
After grading thousands of statistics assignments, professors report the same errors semester after semester. Recognizing them in advance is the fastest way to avoid losing points — or worse, designing a flawed study.
1. Putting the equality in H₁ instead of H₀. The equality (=, ≤, ≥) always belongs in the null hypothesis. H₁ gets strict inequality only. Reversing this breaks the mathematical framework because the test statistic’s reference distribution depends on that boundary value living in H₀.
2. Using sample statistics instead of population parameters. Hypotheses are statements about populations, not samples. Write μ, not x̄. Write p, not p̂. The sample statistic is what you calculate from data; the hypothesis is what you assume about the larger truth.
3. Saying “prove” instead of “reject” or “fail to reject.” Statistical tests do not prove anything. They assess whether observed data are unlikely enough under H₀ to warrant rejecting it. The language matters — peer reviewers will flag “proved the alternative hypothesis” as a fundamental error.
4. Choosing one-tailed to get a smaller p-value. Selecting a one-tailed test after seeing the data is a form of p-hacking. The tail direction must be justified by the research question before data collection. Pre-registration platforms like OSF Registries exist specifically to prevent this kind of post-hoc manipulation.
5. Confusing “fail to reject H₀” with “accept H₀.” Failing to reject the null means the data did not provide sufficient evidence against it. That is not the same as confirming it is true. A jury returning “not guilty” is not declaring innocence — the prosecution simply did not meet its burden. Same logic applies here.
Type I and Type II Errors: The Cost of Getting It Wrong
Every hypothesis test carries two kinds of risk, and understanding them clarifies why significance levels and sample sizes matter so much.
A Type I error (false positive) happens when you reject H₀ even though it is actually true. The significance level α — usually set at 0.05 — directly controls this risk. An α of 0.05 means you accept a 5% chance of falsely rejecting a true null hypothesis. In medicine, a Type I error might mean approving an ineffective drug. In business, it might mean rolling out a website redesign that actually hurts conversions.
A Type II error (false negative) happens when you fail to reject H₀ even though H₁ is actually true. The probability of this error is denoted β, and statistical power (1 − β) represents your test’s ability to detect a real effect. Low power — often caused by small sample sizes — means real effects go unnoticed. A clinical trial with 20 participants might miss a genuinely effective treatment simply because the sample was too small to produce a statistically significant result.
| Error Type | What Happens | Probability | Real-World Consequence |
|---|---|---|---|
| Type I (False Positive) | Reject H₀ when H₀ is true | α (typically 0.05) | Approving an ineffective treatment |
| Type II (False Negative) | Fail to reject H₀ when H₁ is true | β (varies by design) | Missing a real effect or breakthrough |
The tradeoff between these errors is unavoidable. Lowering α reduces Type I risk but increases Type II risk (and vice versa). The only way to reduce both simultaneously is to increase the sample size — which is exactly why power analysis should happen before a study begins, not after.
Frequently Asked Questions
What is the difference between null and alternative hypotheses?
The null hypothesis (H₀) claims there is no effect, no difference, or no relationship — it is the default assumption. The alternative hypothesis (H₁) claims the opposite: that an effect, difference, or relationship exists. H₀ always contains an equality operator (=, ≤, ≥), while H₁ always uses strict inequality (≠, <, >). A statistical test evaluates whether the data provide enough evidence to reject H₀ in favor of H₁.
How do you write null and alternative hypotheses from a word problem?
Start by identifying the research claim — the statement someone is trying to prove with data. That claim becomes H₁. Then write the opposite as H₀. If the claim specifies a direction (“increases,” “reduces,” “is greater than”), use a one-tailed test with < or > in H₁. If the claim is non-directional (“differs,” “changes,” “is not equal to”), use a two-tailed test with ≠ in H₁. Always use population parameters (μ, p), never sample statistics (x̄, p̂).
Can the null hypothesis use a strict inequality like < or >?
No. The null hypothesis must always include an equality component. It uses =, ≤, or ≥ — never strict < or > alone. This is because the probability calculations underlying hypothesis tests require a specific boundary value, and that boundary is defined by the equality in H₀. Placing a strict inequality in H₀ would leave the test without a fixed reference point.
What does “fail to reject the null hypothesis” mean?
It means the data did not provide strong enough statistical evidence to conclude that H₀ is false. Critically, this is not the same as proving H₀ is true. The test may have lacked sufficient power (too small a sample), or the real effect may have been too subtle to detect. Statisticians deliberately avoid saying “accept H₀” because doing so implies a certainty that the test cannot provide.
When should you use a one-tailed test versus a two-tailed test?
Use a one-tailed test when the research question predicts a specific direction — for example, “the new drug lowers blood pressure” or “the redesign increases conversions.” Use a two-tailed test when you suspect a difference exists but cannot predict its direction. Two-tailed tests are more conservative and more widely accepted in academic publishing. The direction must be chosen before data collection — selecting it afterward based on results is considered a form of p-hacking.
Why do the null and alternative hypotheses matter so much?
Because every downstream calculation — the test statistic, degrees of freedom, p-value, confidence interval, and final conclusion — depends on how H₀ and H₁ are formulated. Reversing them, using the wrong operator, or stating them in terms of sample statistics instead of population parameters silently invalidates the entire analysis. Peer reviewers, dissertation committees, and regulatory agencies (like the FDA) will reject work with incorrectly stated hypotheses regardless of how sophisticated the rest of the analysis is.
Hypothesis testing will never be harder than the moment you sit down with a blank page and a research question. Once the null and alternative hypotheses are given their correct symbolic form — right parameter, right operator, right tail — the rest is computation. Master this step first. Everything else follows.
Last modified: March 19, 2026